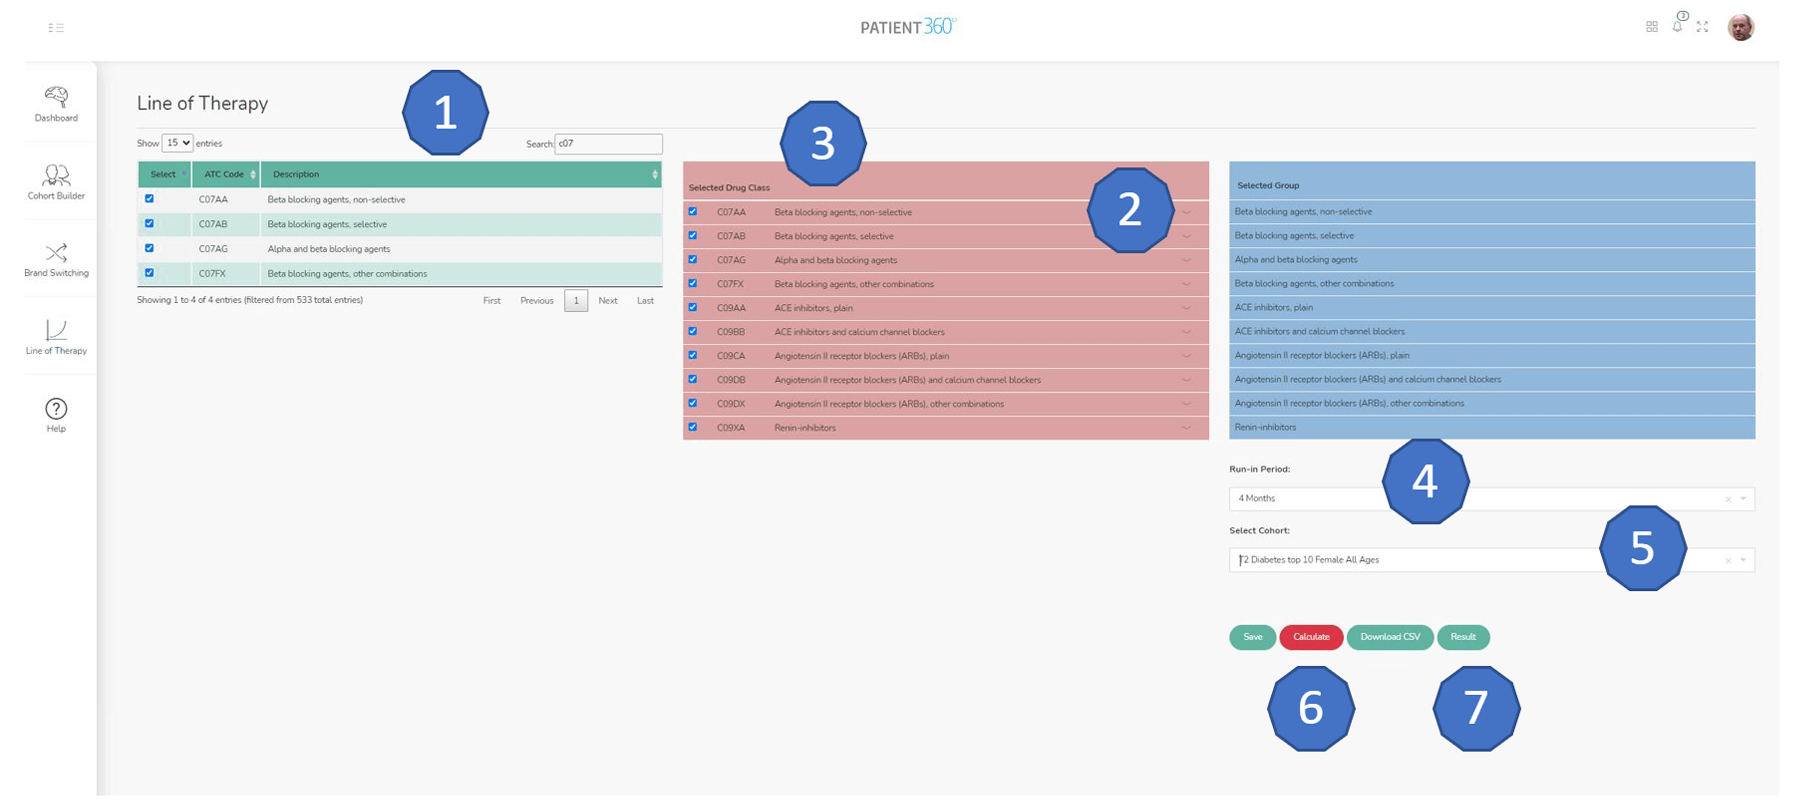
Search works on both ATC Code and ATC Description (see full Glossary for complete listing).
Selected ATCs appear in the central column; selecting the dropdown displays the list of drugs in the ATC;
Select the desired ATCs for calculation and they will appear in the list on the right of the screen;
Select a RUN-IN PERIOD for the calculation (if no Run-in period is required select “No Run-in”);
If desired, select a saved cohort from the drop down;
Select CALCULATE and the Line of Therapy for your selected ATCs will run;
Once calculation is complete (usually less than 2 minutes) the download CSV and RESULTS buttons become active (there is also a Results Ready message appears. Select RESULTS to see a table of output;
Select DOWNLOAD CSV to download tables of full raw results and the summary results table.
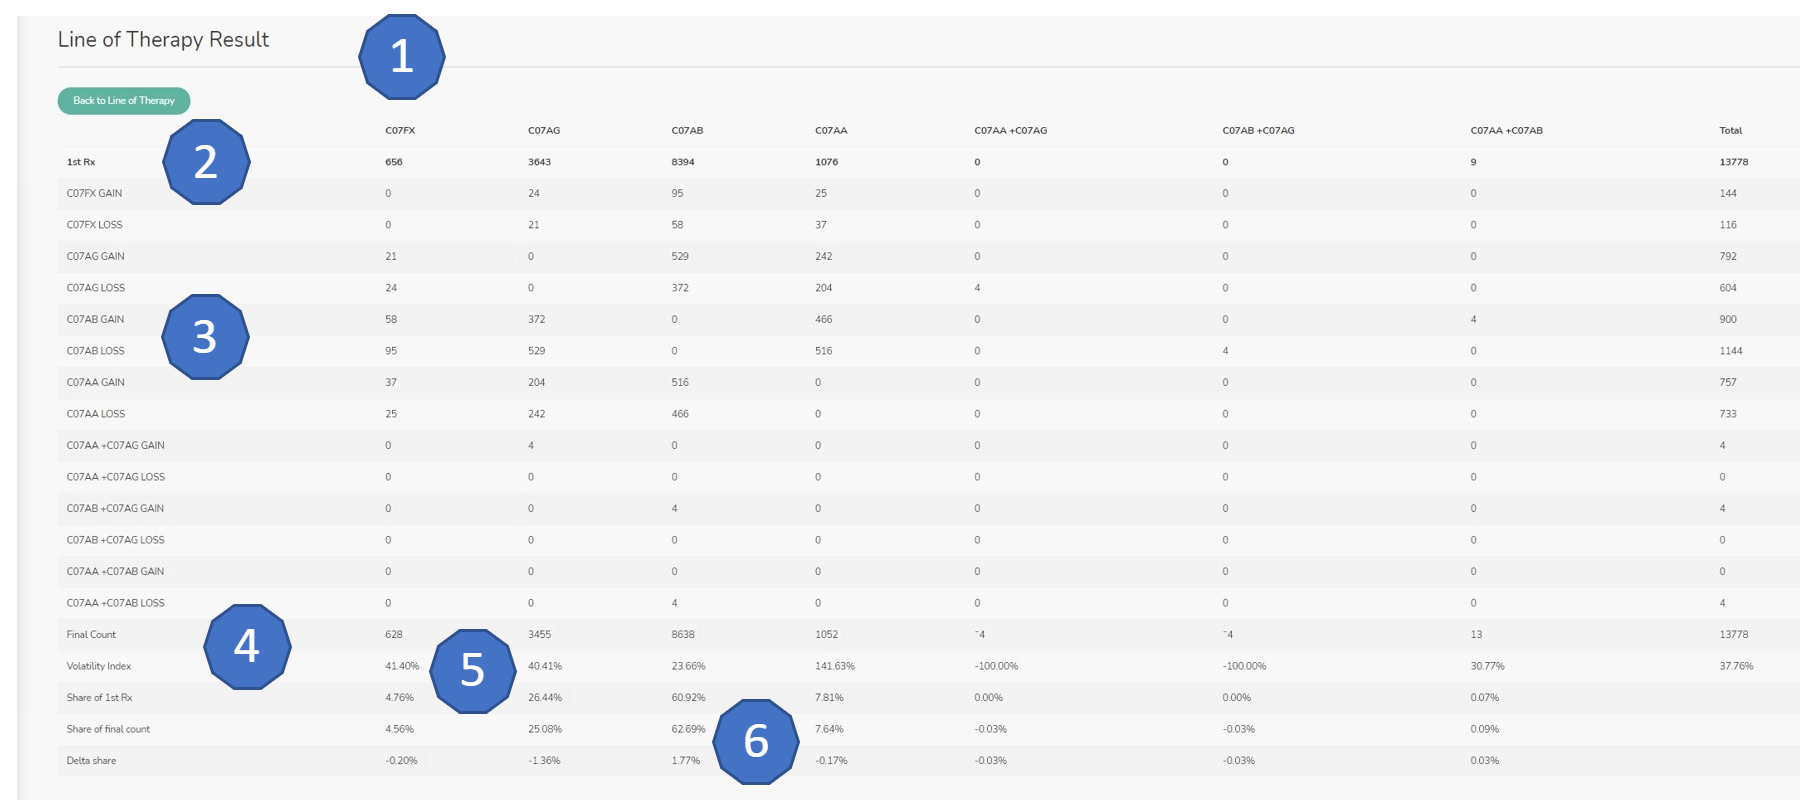
Results
All ATCs in the analysis have a column as well as any combinations (where one prescription contained more than one ATC);
First Rx is the number of patients for whom the ATC was the first line therapy from among the selected ATCs;
Gains and losses show how patients were switched out of and into all the ATCs;
Final Count is the count of patients for who each ATC was the last Rx in the data;
Volatility Index is a measure of how much each ATC is switched (total gains and losses / Final Count);
Shares show share of first and last count as well the change between these two.